
Built-in commands
Everything lives under /script. These commands do not do anything groundbreaking, but they are how you
answer “what is actually loaded right now” without guessing.
| Command | Permission |
|---|---|
/script |
none |
/script tree |
pixelscript.debug |
/script info <file> |
pixelscript.debug |
/script list |
pixelscript.list |
/script timings <enable\|disable> |
pixelscript.profiler.enable / pixelscript.profiler.disable |
/script registrydebug |
pixelscript.debug |
/script evalin <file> <code> |
pixelscript.debug |
/script
The home screen. Shows the plugin version, the Texel engine version, how many scripts are loaded, and how long they took to boot.
A good first thing to check after a deploy: if the script count is lower than you expect, something failed to load.
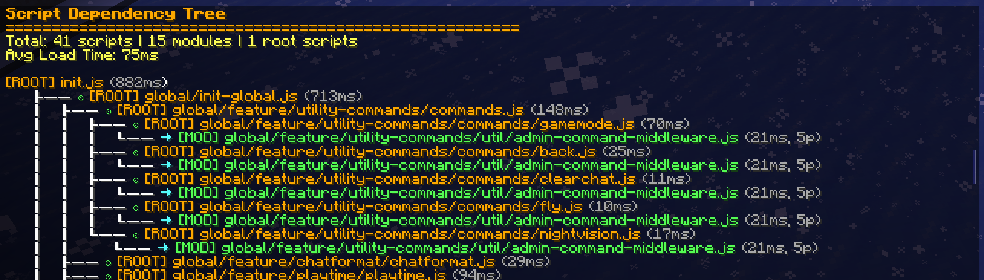
/script tree
Prints the full dependency hierarchy of every loaded script: who loaded what, and why. This is the command for understanding your load tree, and for working out why editing one file reloaded eleven others.
Generated asynchronously, so it takes a moment to appear.
/script info <file>
Takes a path relative to the scripts directory and prints everything known about that script:
- Its instance ID and whether it is a module
- Its parents, the scripts that caused it to load
- Its extensions, the globals bound into its scope
- Its load time
- Its profiler data, with average, minimum and maximum durations per measured task
/script info global/feature/playtime/lib/lib-playtime.js

Tab completion suggests loaded script paths, so you rarely have to type the whole thing.
/script list
Every currently loaded script by path. Quicker than tree when you only want to confirm that something is
loaded at all.
/script timings <enable|disable>
Turns profiler collection on or off. Enabled by default. See Performance profiling.
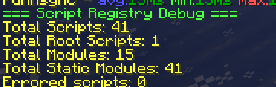
/script registrydebug
Counts scripts, root scripts, modules, isolate modules and failed scripts. Semi-internal, mostly useful when we are helping you diagnose a resolver issue.
/script evalin <file> <code>
Evaluates JS in the scope of an already-loaded script, without editing the script itself. Useful for manual or agentic debugging: call an individual function or inspect a variable from a script without touching the file (and without triggering a reload).
/script evalin global/features/machines/api/chainable.ts log("hello from chainable!");
The <file> path is relative to the scripts directory, same as /script info, and tab completion
suggests loaded script paths.
If <code> is a bare variable name, its current value is returned in chat instead of undefined.
Anything else is evaluated as a statement/expression and, if it returns a value, that return value is
shown instead.
/script evalin global/features/machines/api/chainable.ts machineRegistry