
Performance profiling
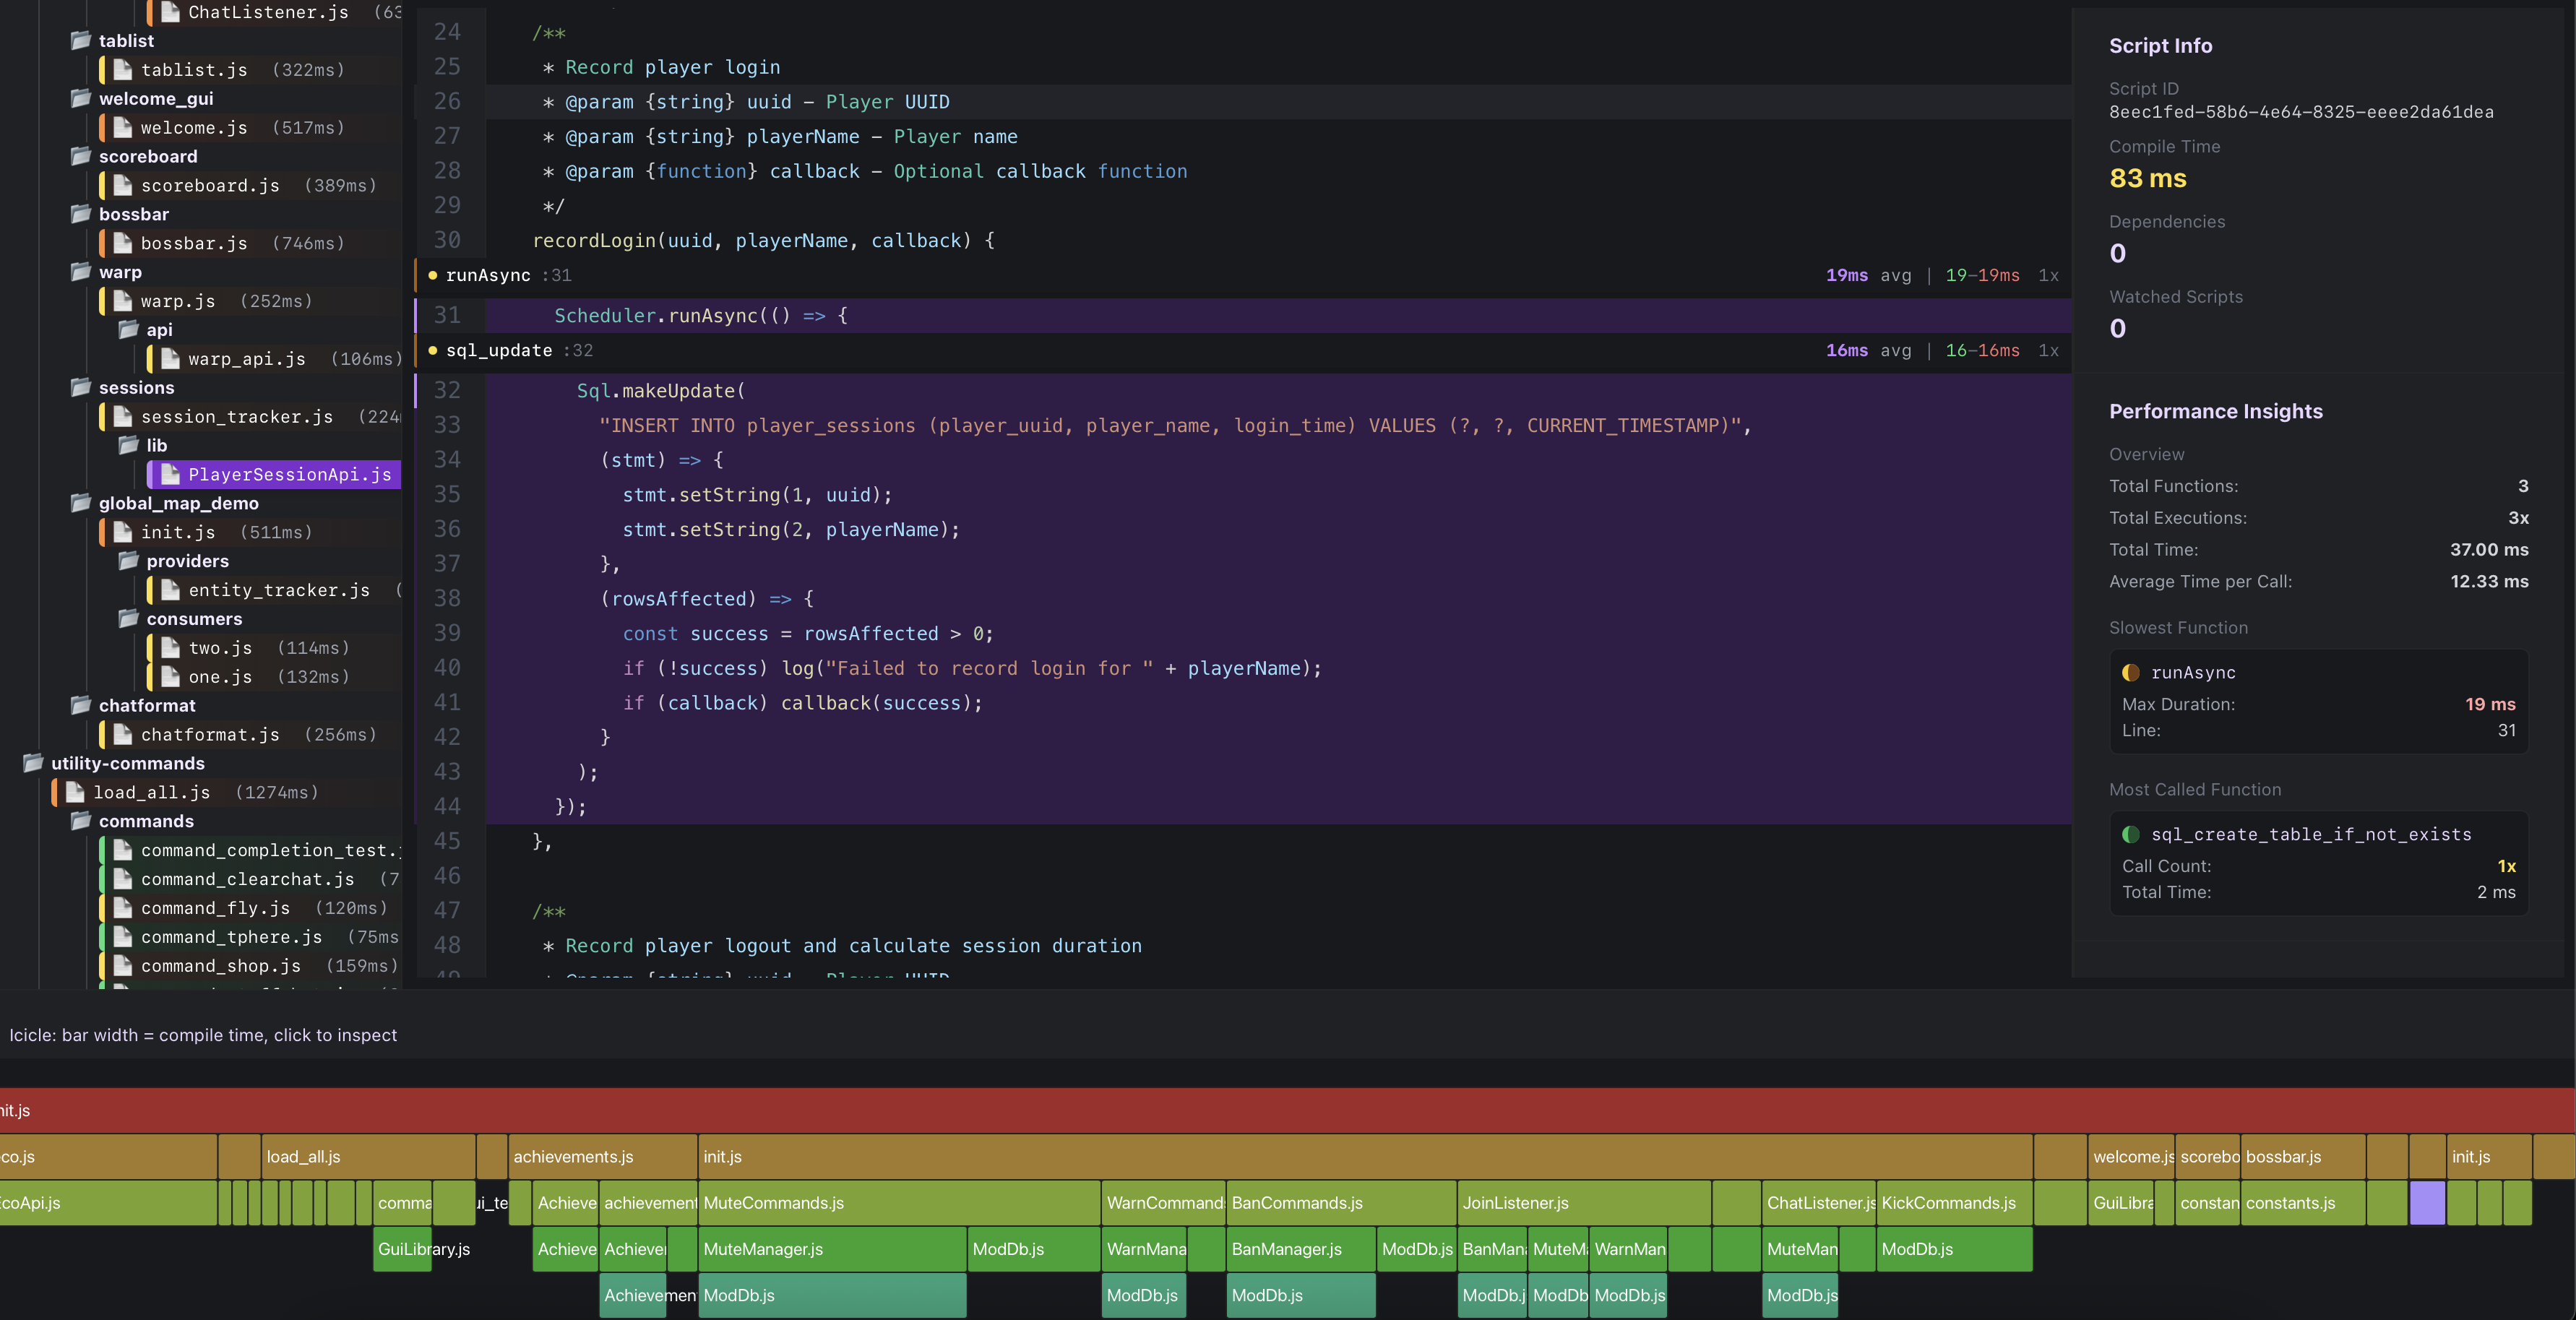
Performance matters at scale, and guessing where the time goes is a waste of an afternoon. PixelScript measures itself.
What is measured automatically
Timings are collected for every out-of-band invocation the runtime controls:
- Scheduler task executions
- Event listener invocations
- Command invocations
Script.loadClasscalls$magic import resolutions- Module loads
Sqlqueries, updates and transactionsfetchcalls
Each is recorded per script, with average, shortest and longest durations. Timings are enabled by default because the overhead is tiny and the payoff is not.
Measuring your own code
Wrap anything you want to see separately with Script.measure:
Script.measure('rebuild-scoreboard', () => {
  Bukkit.getOnlinePlayers().forEach(updateScoreboard);
});
It appears in the profiler output under that name. Use this instead of logging timestamps: it costs nothing when timings are off, and it aggregates over many invocations rather than giving you one sample.
Reading the results
/script info <path> prints the profile for one script, alongside its parents and bound extensions:
/script info global/feature/playtime/lib/lib-playtime.js

Durations are colour-coded, so a slow entry is obvious at a glance. The columns are average, minimum and maximum, which matters: a listener averaging 0.2 ms with a 400 ms maximum has an occasional pathological path that an average alone hides.
Turning timings off
If you are squeezing the last percent out of a busy server:
/script timings disable
/script timings enable
Permissions are pixelscript.profiler.disable and pixelscript.profiler.enable. Disabling clears
collection, so re-enable it before investigating anything.
Where the time usually goes
In rough order of how often it turns out to be the culprit:
- Per-tick timers doing per-player work. A
runSyncTimerat period 1 that loops over every online player is 20 times more work per second than one at period 20. Ask whether it really needs to be every tick. - Blocking calls on the main thread.
Sqlandfetchblock. If they show up in a main-thread profile at all, they are in the wrong place. See the concurrency model. $lookups in hot paths. Cached after the first hit, but still a map lookup. Hoist them into aconstat module level. See magic imports.- Reload cascades. Not a runtime cost, but a development one.
/script treeshows how much reloads when you touch a shared module.
Status
The profiler is in beta and its output format may change between releases.